diff options
Diffstat (limited to 'FSF-2020/calculus/intro-to-calculus/limit')
4 files changed, 164 insertions, 73 deletions
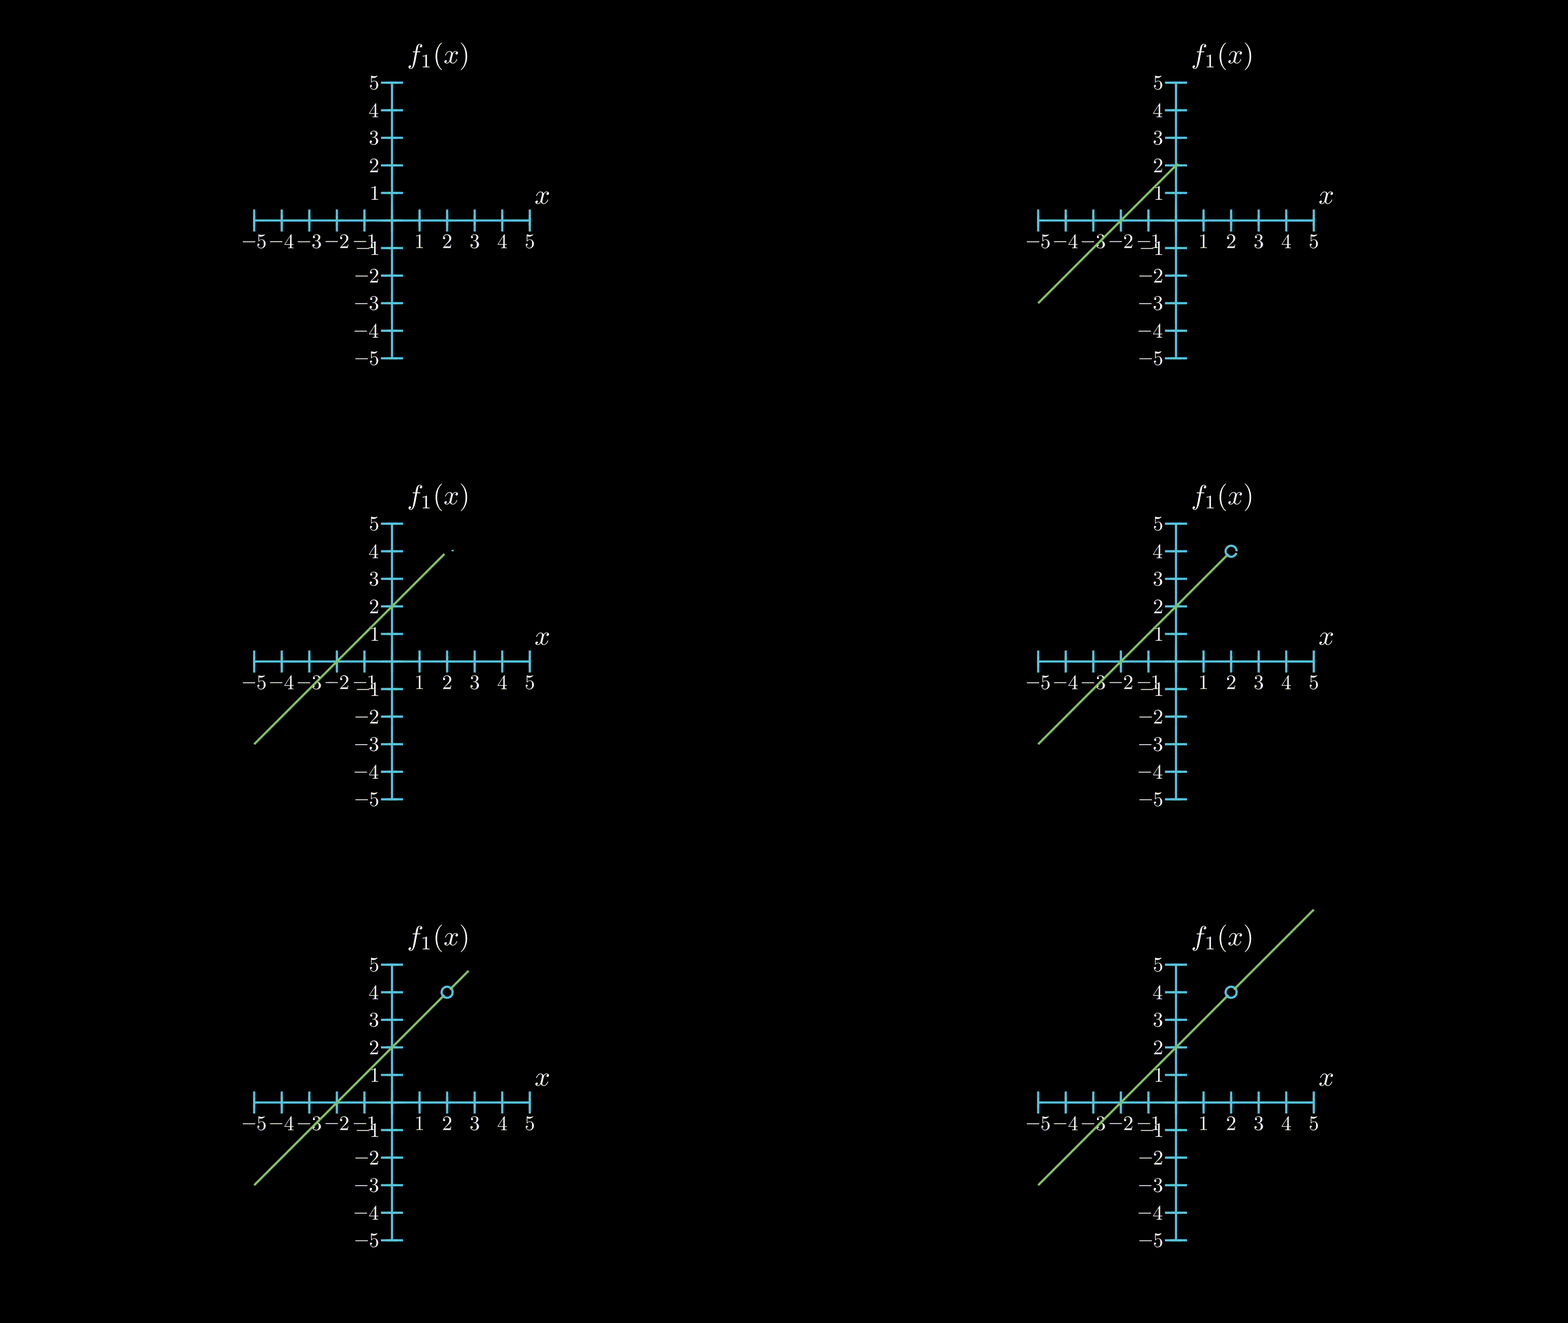
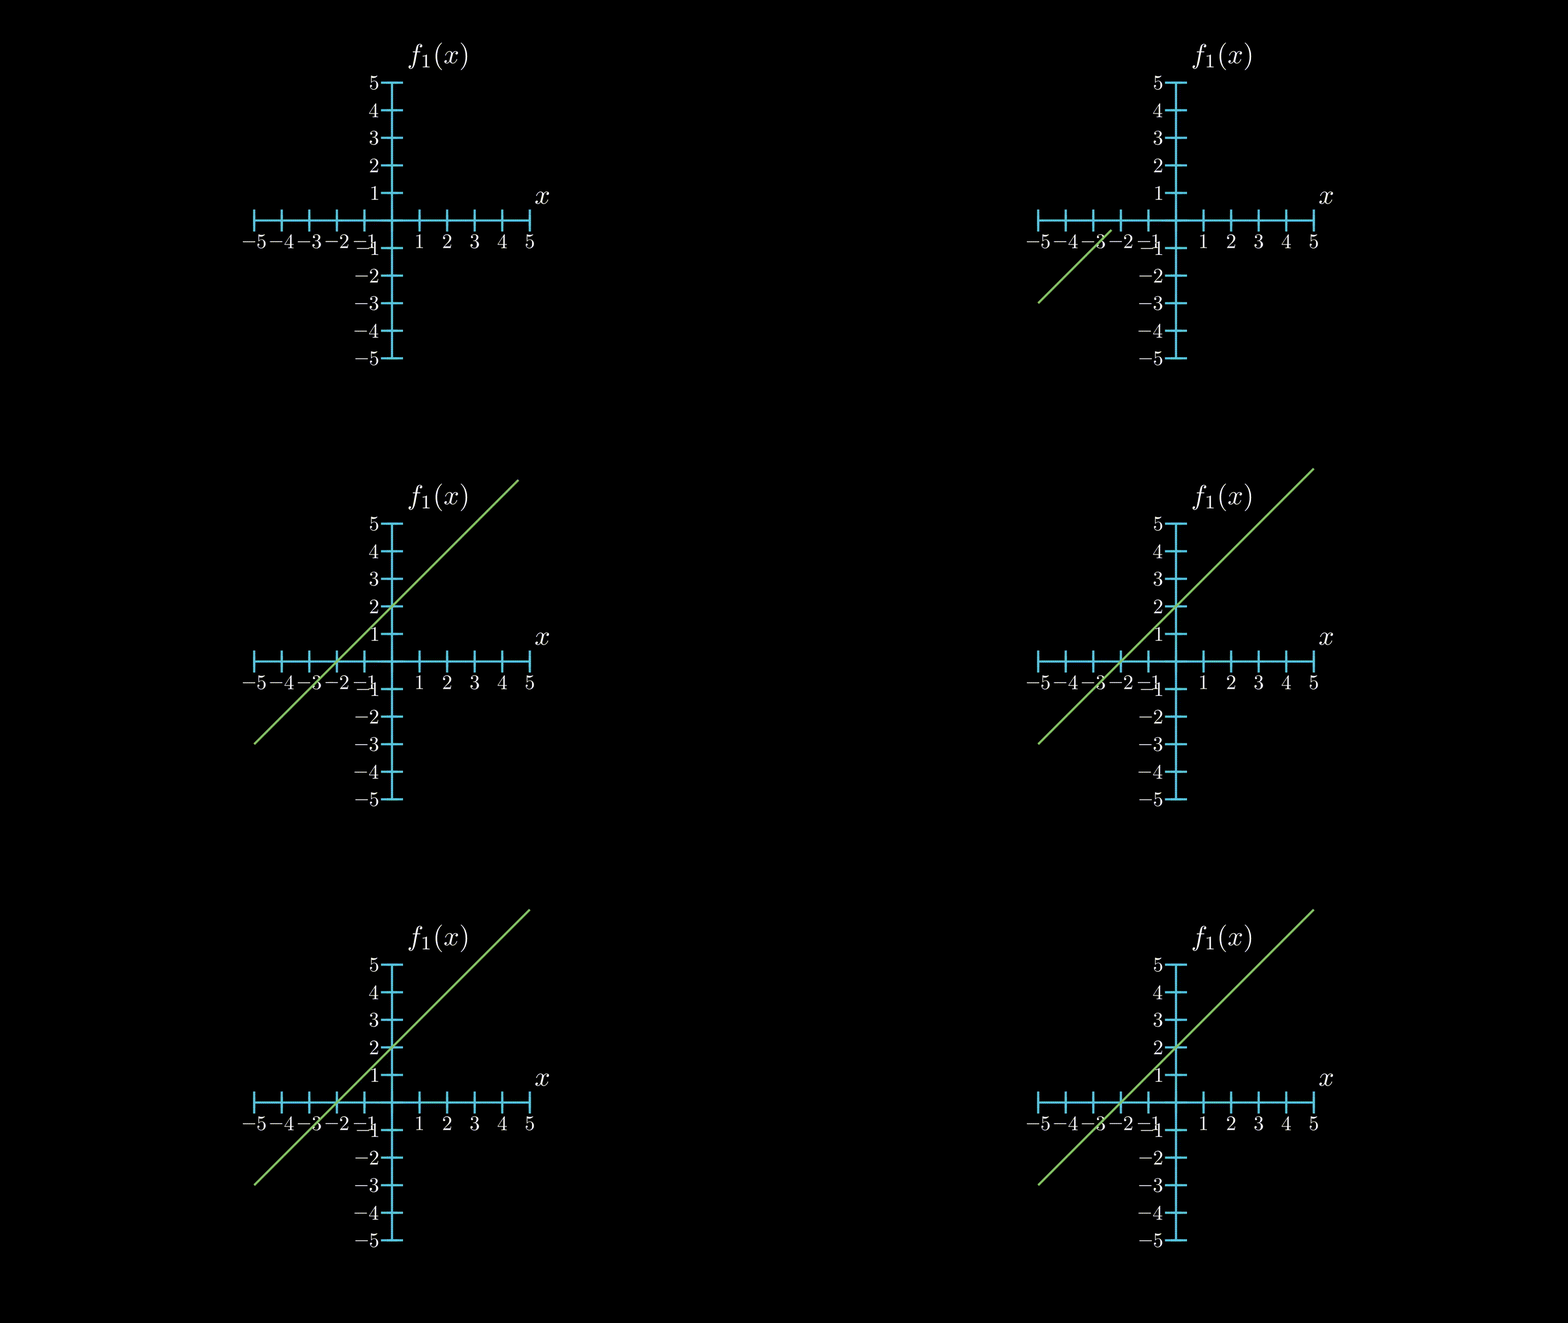
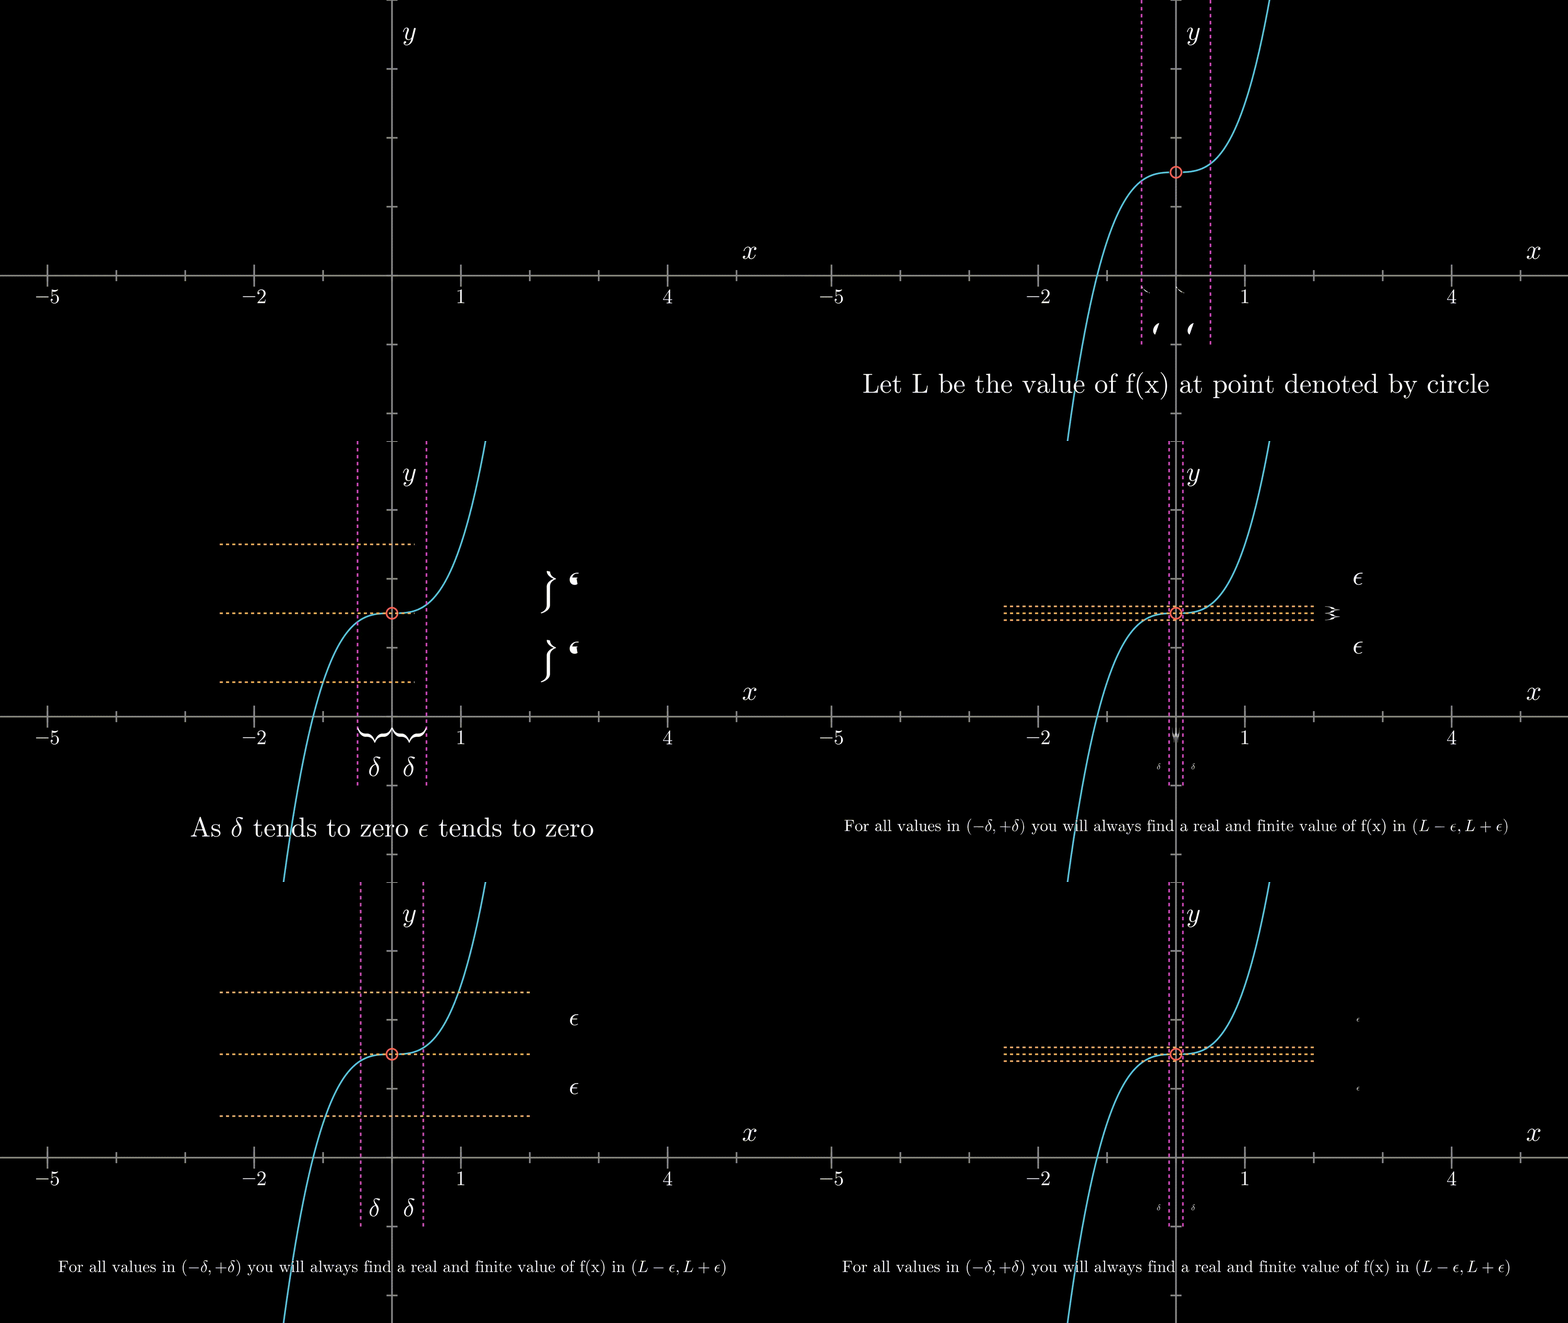
diff --git a/FSF-2020/calculus/intro-to-calculus/limit/README.md b/FSF-2020/calculus/intro-to-calculus/limit/README.md new file mode 100644 index 0000000..d56950e --- /dev/null +++ b/FSF-2020/calculus/intro-to-calculus/limit/README.md @@ -0,0 +1,18 @@ +Test1 + + +Test2 + + +limit1 + + +limit3 + + +limitfin1 + + +limitfin2 + + diff --git a/FSF-2020/calculus/intro-to-calculus/limit/limitdef.py b/FSF-2020/calculus/intro-to-calculus/limit/limitdef.py deleted file mode 100644 index 15f2845..0000000 --- a/FSF-2020/calculus/intro-to-calculus/limit/limitdef.py +++ /dev/null @@ -1,73 +0,0 @@ -from manimlib.imports import * -class limitdef(GraphScene, Scene): - CONFIG = { - "y_max" : 5, - "y_min" : 0, - "x_max" : 5, - "x_min" : -5, - "y_tick_frequency" : 1, - "x_tick_frequency" : 1, - "axes_color" : WHITE, - "num_graph_anchor_points": 3000, #this is the number of points that graph manim - "graph_origin" : ORIGIN+2*DOWN, - "x_labeled_nums": None,#list(range(-1,2)), - "y_labeled_nums": None,#list(range(0,2)), - "x_axis_label":"$x$", - "y_axis_label":"$f(x)$", - "x_axis_width": 10, - "y_axis_height": 5, - } - def construct(self): - Ldot = MediumDot(self.graph_origin+2.1*UP).set_color(GREEN_SCREEN) - adot = MediumDot(self.graph_origin+3*RIGHT).set_color(PINK) - epline1 = DashedVMobject(Line(self.graph_origin+1*LEFT+2.5*UP, self.graph_origin+4*RIGHT+2.5*UP)) - epline2 = DashedVMobject(Line(self.graph_origin+1*LEFT+1.7*UP, self.graph_origin+4*RIGHT+1.7*UP)) - epline3 = DashedVMobject(Line(self.graph_origin+3.5*RIGHT+0.5*DOWN, self.graph_origin+3.5*RIGHT+2.5*UP)) - epline4 = DashedVMobject(Line(self.graph_origin+2.5*RIGHT+0.5*DOWN, self.graph_origin+2.5*RIGHT+2.5*UP)) - Lline = Line(self.graph_origin+2.1*UP, self.graph_origin+3*RIGHT+2.1*UP).set_color(GREEN_SCREEN) - aline = Line(self.graph_origin+3*RIGHT, self.graph_origin+3*RIGHT+2.1*UP).set_color(PINK) - vertical_rectangle = Rectangle(width = 1, height = 0.8, color = PINK, fill_opacity = 0.5, fill_color = LIGHT_PINK).move_to(self.graph_origin+3*RIGHT+2.1*UP) - horizontal_rectangle = Rectangle(width = 1, height = 0.8, color = GREEN_SCREEN, fill_opacity = 0.5, fill_color = GREEN).move_to(self.graph_origin+3*RIGHT+2.1*UP) - vec1 = Line(self.graph_origin+2.5*UP, self.graph_origin+2.1*UP) - vec2 = Line(self.graph_origin+2.1*UP, self.graph_origin+1.7*UP) - vec3 = Line(self.graph_origin+2.5*RIGHT, self.graph_origin+3*RIGHT) - vec4 = Line(self.graph_origin+3*RIGHT, self.graph_origin+3.5*RIGHT) - brace1 = Brace(vec1, LEFT) - brace2 = Brace(vec2, LEFT) - brace3 = Brace(vec3, DOWN) - brace4 = Brace(vec4, DOWN) - br1text = brace1.get_text(r"$\epsilon$").next_to(brace1, LEFT) - br2text = brace2.get_text(r"$\epsilon$").next_to(brace2, LEFT) - br3text = brace3.get_text(r"$\delta$").next_to(brace3, DOWN) - br4text = brace4.get_text(r"$\delta$").next_to(brace4, DOWN) - epgrp = VGroup(epline1, epline2, Ldot, adot, Lline, aline, epline4, epline3) - recgrp = VGroup(vertical_rectangle, horizontal_rectangle) - epbrgrp = VGroup(brace1, brace2, br1text, br2text) - delbrgrp = VGroup(brace3, brace4, br3text, br4text) - self.setup_axes() - graph_1 = self.get_graph(lambda x :0.1*(x+1)**2 +0.5, x_min = -5, x_max = 5) - graph_2 = self.get_graph(lambda x : 0.1*(x+1)**2 +0.5, x_min = 2.5, x_max = 3.5, color = YELLOW_A) - graph_2.shift(2.5*LEFT) - self.play(ShowCreation(graph_1)) - self.wait(2) - self.play(ShowCreation(epgrp), ShowCreation(horizontal_rectangle), ShowCreation(vertical_rectangle)) - self.wait(2) - self.play(ShowCreation(epbrgrp)) - self.play(ShowCreation(delbrgrp)) - self.wait(2) - self.play(FadeOut(recgrp)) - self.wait(2) - for i in range(0,1): - self.play(ApplyMethod(graph_2.shift, 2.5*RIGHT)) - self.wait(1) - self.play(ApplyMethod(graph_2.shift, 1.7*DOWN)) - self.play(ApplyMethod(graph_2.shift, 1.7*UP)) - self.wait(1) - self.play(ApplyMethod(graph_2.shift, 2.5*LEFT)) - self.play(ApplyMethod(graph_2.shift, 2.5*RIGHT)) - self.wait(1) - self.play(ApplyMethod(graph_2.shift, 1.7*DOWN)) - self.play(ApplyMethod(graph_2.shift, 1.7*UP)) - self.wait(1) - self.play(ApplyMethod(graph_2.shift, 2.5*LEFT)) - self.wait() diff --git a/FSF-2020/calculus/intro-to-calculus/limit/limitfin1.py b/FSF-2020/calculus/intro-to-calculus/limit/limitfin1.py new file mode 100644 index 0000000..ba57a15 --- /dev/null +++ b/FSF-2020/calculus/intro-to-calculus/limit/limitfin1.py @@ -0,0 +1,76 @@ +from manimlib.imports import * +class limitfin1(GraphScene): + CONFIG = { + "x_min" : -8, + "x_max" : 8, + "x_labeled_nums" : list(range(-8, 10, 3)), + "x_axis_width" : FRAME_WIDTH - LARGE_BUFF, + "y_min" : -4, + "y_max" : 4, + "y_labeled_nums" : None, + "y_axis_height" : FRAME_HEIGHT+2*LARGE_BUFF, + "graph_origin" : DOWN, + "graph_color" : BLUE, + "x_axis_width":20, + "y_axis_height":10, + } + def construct(self): + self.setup_axes() + XTD = 10/(8 - (-8)) + YTD = 10/(4 - (-4)) + graph1 = self.get_graph(lambda x: x**3 +1.5, x_min = self.x_min, x_max = -0.1) + graph2 = self.get_graph(lambda x: x**3 +1.5, x_min = 0.1, x_max = self.x_max, color = self.graph_color) + dot2 = Circle(radius = 0.1).move_to(self.graph_origin+1.5*UP*YTD) + text0 = TextMobject("Let L be the value of f(x) at point denoted by circle").move_to(self.graph_origin+2*DOWN) + text1 = TexMobject(r"\text{As }", r"\delta",r"\text{ tends to zero }" ,r"\epsilon" r"\text{ tends to zero}").move_to(self.graph_origin+2*DOWN) + text2 = TexMobject(r"\text{For all values in }", r"(-\delta, +\delta)",r"\text{ you will always find a real and finite value of f(x) in }",r"(L-\epsilon, L+\epsilon)").move_to(self.graph_origin+2*DOWN).scale(0.6) + self.play(ShowCreation(graph1), ShowCreation(graph2), ShowCreation(text0), FadeIn(dot2)) + line1 = DashedVMobject(Line(self.graph_origin+1*DOWN*YTD+1*LEFT*XTD, self.graph_origin+4*UP*YTD+1*LEFT*XTD), num_dashes = 50).set_color(PINK) + line2 = DashedVMobject(Line(self.graph_origin+1*DOWN*YTD+1*RIGHT*XTD, self.graph_origin+4*UP*YTD+1*RIGHT*XTD), num_dashes = 50).set_color(PINK) + line3 = DashedVMobject(Line(self.graph_origin+1.5*UP*YTD+5*LEFT*XTD, self.graph_origin+1.5*UP*YTD+4*RIGHT*XTD), num_dashes = 50).set_color(GOLD) + line4 = DashedVMobject(Line(self.graph_origin+0.5*UP*YTD+5*LEFT*XTD, self.graph_origin+0.5*UP*YTD+4*RIGHT*XTD), num_dashes = 50).set_color(GOLD) + line5 = DashedVMobject(Line(self.graph_origin+2.5*UP*YTD+5*LEFT*XTD, self.graph_origin+2.5*UP*YTD+4*RIGHT*XTD), num_dashes = 50).set_color(GOLD) + self.play(ShowCreation(line1), ShowCreation(line2)) + vec1 = Line(self.graph_origin, self.graph_origin+1*RIGHT*XTD) + vec2 = Line(self.graph_origin, self.graph_origin+1*LEFT*XTD) + vec5 = Line(self.graph_origin+2.5*UP*YTD+4*RIGHT*XTD, self.graph_origin+1.5*UP*YTD+4*RIGHT*XTD) + vec6 = Line(self.graph_origin+0.5*UP*YTD+4*RIGHT*XTD, self.graph_origin+1.5*UP*YTD+4*RIGHT*XTD) + brace1 = Brace(vec1, DOWN) + brace2 = Brace(vec2, DOWN) + br1text = brace1.get_text(r"$\delta$").next_to(brace1, DOWN) + br2text = brace2.get_text(r"$\delta$").next_to(brace2, DOWN) + brace5 = Brace(vec5, RIGHT) + brace6 = Brace(vec6, RIGHT) + br5text = brace5.get_text(r"$\epsilon$").next_to(brace5, RIGHT) + br6text = brace6.get_text(r"$\epsilon$").next_to(brace6, RIGHT) + self.wait(3) + self.play(ShowCreation(brace1), ShowCreation(brace2), ShowCreation(br1text), ShowCreation(br2text)) + self.wait(3) + self.play(ReplacementTransform(text0, text1)) + self.play(ShowCreation(line3), ShowCreation(line4), ShowCreation(line5), ShowCreation(brace5), ShowCreation(brace6), ShowCreation(br5text), ShowCreation(br6text)) + vec3 = Line(self.graph_origin, self.graph_origin+0.1*RIGHT*XTD) + vec4 = Line(self.graph_origin, self.graph_origin+0.11*LEFT*XTD) + brace3 = Brace(vec3, DOWN) + brace4 = Brace(vec4, DOWN) + vec7 = Line(self.graph_origin+1.6*UP*YTD+4*RIGHT*XTD, self.graph_origin+1.5*UP*YTD+4*RIGHT*XTD) + vec8 = Line(self.graph_origin+1.4*UP*YTD+4*RIGHT*XTD, self.graph_origin+1.5*UP*YTD+4*RIGHT*XTD) + brace7 = Brace(vec7, RIGHT) + brace8 = Brace(vec8, RIGHT) + self.play(Transform(brace1, brace3), Transform(brace2, brace4), ApplyMethod(line2.shift, 0.8*LEFT*XTD), + ApplyMethod(line1.shift, 0.8*RIGHT*XTD), ApplyMethod(br1text.scale, 0.3), ApplyMethod(br2text.scale, 0.3), + Transform(brace5, brace7), Transform(brace6, brace8), ApplyMethod(line4.shift, 1.8*UP*XTD), + ApplyMethod(line5.shift, 1.8*DOWN*XTD)) + self.wait(3) + self.play(ReplacementTransform(text1, text2)) + self.play(FadeOut(brace5), FadeOut(brace6), FadeOut(brace1), FadeOut(brace2)) + self.play(ApplyMethod(line2.shift, 0.8*RIGHT*XTD), ApplyMethod(line1.shift, 0.8*LEFT*XTD), ApplyMethod(br1text.scale, 10/3), ApplyMethod(br2text.scale, 10/3), + ApplyMethod(line5.shift, 1.8*UP*XTD), ApplyMethod(line4.shift, 1.8*DOWN*XTD)) + for i in range(0,3): + self.play(ApplyMethod(line2.shift, 0.8*LEFT*XTD), ApplyMethod(line1.shift, 0.8*RIGHT*XTD), ApplyMethod(br1text.scale, 0.3), ApplyMethod(br2text.scale, 0.3), + ApplyMethod(line5.shift, 1.8*DOWN*XTD), ApplyMethod(line4.shift, 1.8*UP*XTD), ApplyMethod(br5text.scale, 0.3), ApplyMethod(br6text.scale, 0.3), run_time = 0.5) + self.play(ApplyMethod(line2.shift, 0.8*RIGHT*XTD), ApplyMethod(line1.shift, 0.8*LEFT*XTD), ApplyMethod(br1text.scale, 10/3), ApplyMethod(br2text.scale, 10/3), + ApplyMethod(line5.shift, 1.8*UP*XTD), ApplyMethod(line4.shift, 1.8*DOWN*XTD), ApplyMethod(br5text.scale, 10/3), ApplyMethod(br6text.scale ,10/3), run_time = 0.5) + self.play(ApplyMethod(line2.shift, 0.8*LEFT*XTD), ApplyMethod(line1.shift, 0.8*RIGHT*XTD), ApplyMethod(br1text.scale, 0.3), ApplyMethod(br2text.scale, 0.3), + ApplyMethod(line5.shift, 1.8*DOWN*XTD), ApplyMethod(line4.shift, 1.8*UP*XTD),ApplyMethod(br5text.scale, 0.3), ApplyMethod(br6text.scale, 0.3), run_time = 0.5) + + self.wait(5)
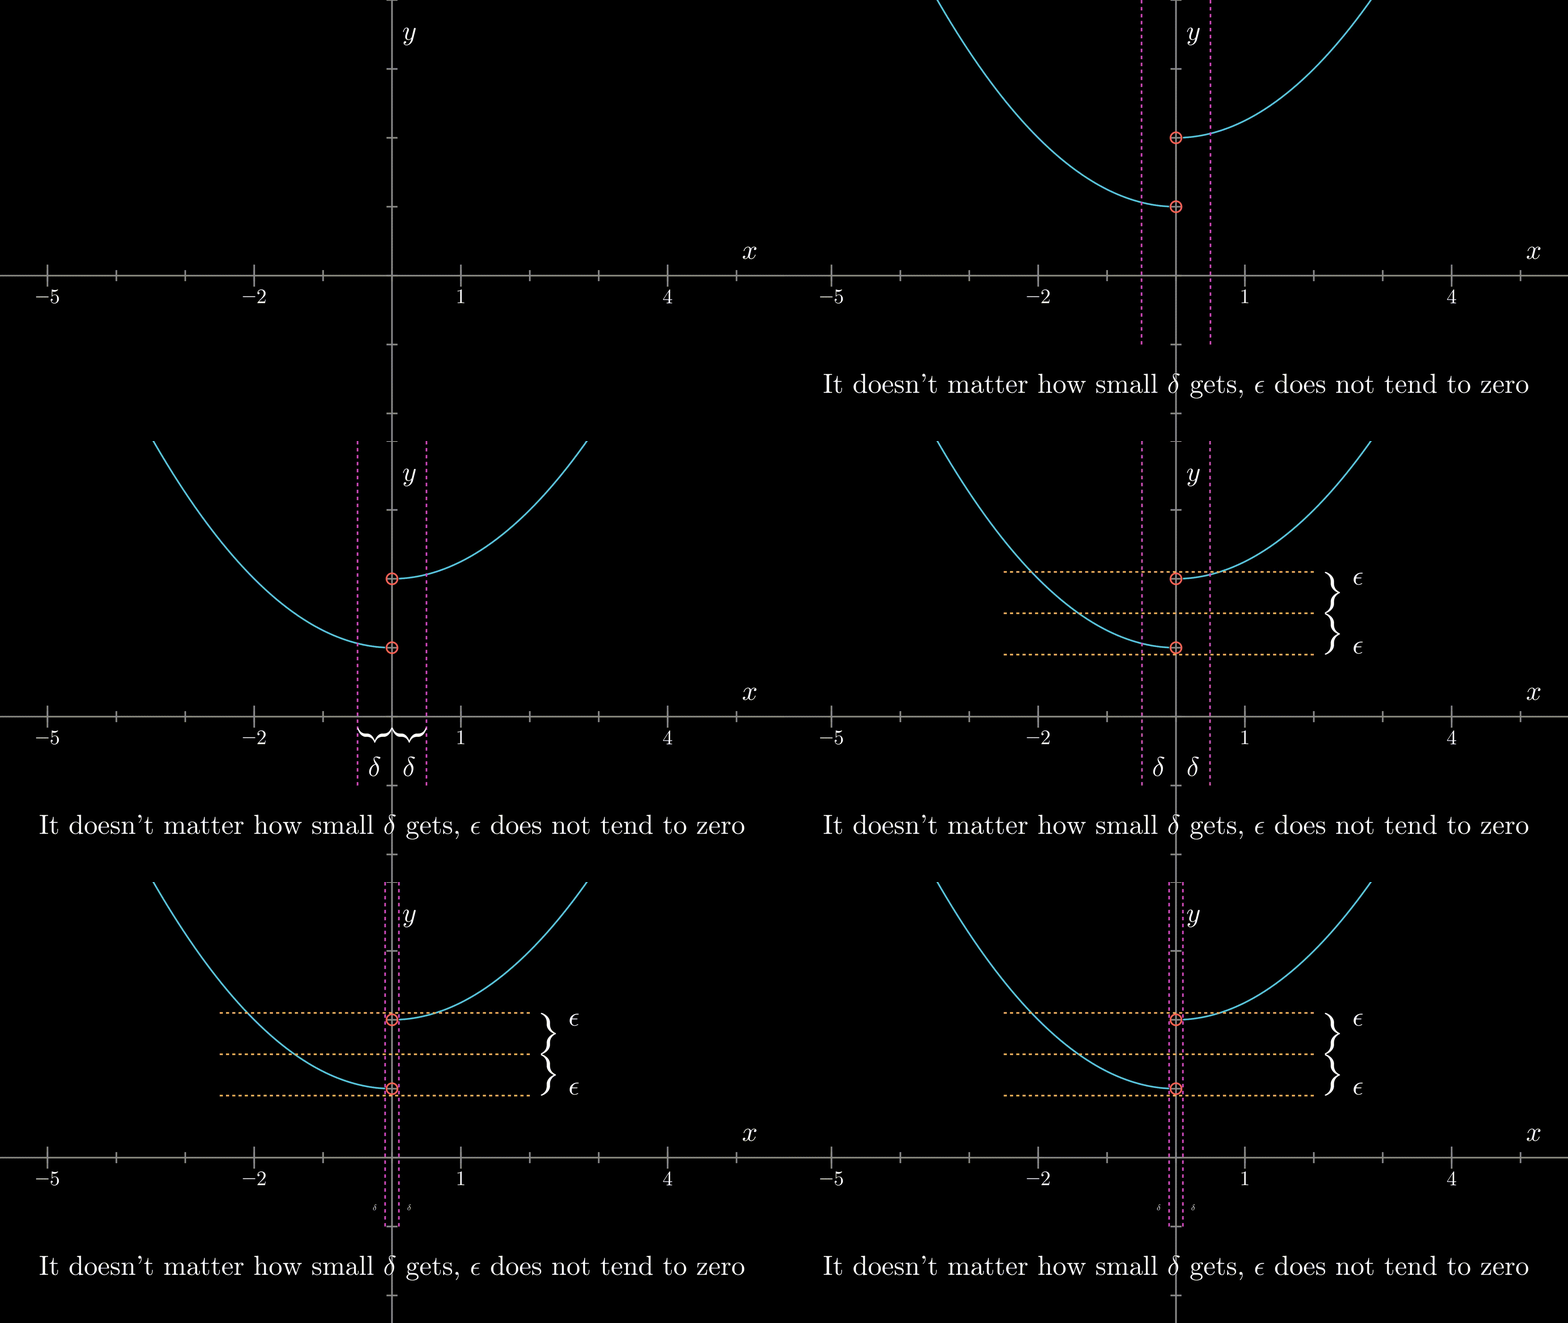
\ No newline at end of file diff --git a/FSF-2020/calculus/intro-to-calculus/limit/limitfin2.py b/FSF-2020/calculus/intro-to-calculus/limit/limitfin2.py new file mode 100644 index 0000000..36ca388 --- /dev/null +++ b/FSF-2020/calculus/intro-to-calculus/limit/limitfin2.py @@ -0,0 +1,70 @@ +from manimlib.imports import * +class limitfin2(GraphScene): + CONFIG = { + "x_min" : -8, + "x_max" : 8, + "x_labeled_nums" : list(range(-8, 10, 3)), + "x_axis_width" : FRAME_WIDTH - LARGE_BUFF, + "y_min" : -4, + "y_max" : 4, + "y_labeled_nums" : None,#list(range(3,,)), + "y_axis_height" : FRAME_HEIGHT+2*LARGE_BUFF, + "graph_origin" : DOWN, + "graph_color" : BLUE, + "x_axis_width":20, + "y_axis_height":10, + } + def construct(self): + self.setup_axes() + XTD = 10/(8 - (-8)) + YTD = 10/(4 - (-4)) + graph1 = self.get_graph(lambda x: -(-(0.25*x**2)-1), x_min = self.x_min, x_max = -0.1) + graph2 = self.get_graph(lambda x: ((0.25*x**2)+2), x_min = 0.1, x_max = self.x_max, color = self.graph_color) + dot1 = Circle(radius = 0.1).move_to(self.graph_origin+1*UP*YTD) + dot2 = Circle(radius = 0.1).move_to(self.graph_origin+2*UP*YTD) + text1 = TexMobject(r"\text{It doesn't matter how small }", r"\delta",r"\text{ gets, }" r"\epsilon" r"\text{ does not tend to zero}").move_to(self.graph_origin+2*DOWN) + self.play(ShowCreation(graph1), ShowCreation(graph2), ShowCreation(text1), FadeIn(dot1), FadeIn(dot2)) + line1 = DashedVMobject(Line(self.graph_origin+1*DOWN*YTD+1*LEFT*XTD, self.graph_origin+4*UP*YTD+1*LEFT*XTD), num_dashes = 50).set_color(PINK) + line2 = DashedVMobject(Line(self.graph_origin+1*DOWN*YTD+1*RIGHT*XTD, self.graph_origin+4*UP*YTD+1*RIGHT*XTD), num_dashes = 50).set_color(PINK) + line3 = DashedVMobject(Line(self.graph_origin+1.5*UP*YTD+5*LEFT*XTD, self.graph_origin+1.5*UP*YTD+4*RIGHT*XTD), num_dashes = 50).set_color(GOLD) + line4 = DashedVMobject(Line(self.graph_origin+0.5*UP*YTD+5*LEFT*XTD, self.graph_origin+0.5*UP*YTD+4*RIGHT*XTD), num_dashes = 50).set_color(GOLD) + line5 = DashedVMobject(Line(self.graph_origin+2.5*UP*YTD+5*LEFT*XTD, self.graph_origin+2.5*UP*YTD+4*RIGHT*XTD), num_dashes = 50).set_color(GOLD) + self.play(ShowCreation(line1), ShowCreation(line2)) + vec1 = Line(self.graph_origin, self.graph_origin+1*RIGHT*XTD) + vec2 = Line(self.graph_origin, self.graph_origin+1*LEFT*XTD) + vec5 = Line(self.graph_origin+2.5*UP*YTD+4*RIGHT*XTD, self.graph_origin+1.5*UP*YTD+4*RIGHT*XTD) + vec6 = Line(self.graph_origin+0.5*UP*YTD+4*RIGHT*XTD, self.graph_origin+1.5*UP*YTD+4*RIGHT*XTD) + brace1 = Brace(vec1, DOWN) + brace2 = Brace(vec2, DOWN) + br1text = brace1.get_text(r"$\delta$").next_to(brace1, DOWN) + br2text = brace2.get_text(r"$\delta$").next_to(brace2, DOWN) + brace5 = Brace(vec5, RIGHT) + brace6 = Brace(vec6, RIGHT) + br5text = brace5.get_text(r"$\epsilon$").next_to(brace5, RIGHT) + br6text = brace6.get_text(r"$\epsilon$").next_to(brace6, RIGHT) + self.wait(3) + self.play(ShowCreation(brace1), ShowCreation(brace2), ShowCreation(br1text), ShowCreation(br2text)) + self.wait(3) + self.play(ShowCreation(line3), ShowCreation(line4), ShowCreation(line5), ShowCreation(brace5), ShowCreation(brace6), ShowCreation(br5text), ShowCreation(br6text)) + vec3 = Line(self.graph_origin, self.graph_origin+0.1*RIGHT*XTD) + vec4 = Line(self.graph_origin, self.graph_origin+0.11*LEFT*XTD) + brace3 = Brace(vec3, DOWN) + brace4 = Brace(vec4, DOWN) + vec7 = Line(self.graph_origin+2.1*UP*YTD+4*RIGHT*XTD, self.graph_origin+1.5*UP*YTD+4*RIGHT*XTD) + vec8 = Line(self.graph_origin+0.9*UP*YTD+4*RIGHT*XTD, self.graph_origin+1.5*UP*YTD+4*RIGHT*XTD) + brace7 = Brace(vec7, RIGHT) + brace8 = Brace(vec8, RIGHT) + self.play(Transform(brace1, brace3), Transform(brace2, brace4), ApplyMethod(line2.shift, 0.8*LEFT*XTD), + ApplyMethod(line1.shift, 0.8*RIGHT*XTD), ApplyMethod(br1text.scale, 0.3), ApplyMethod(br2text.scale, 0.3), + Transform(brace5, brace7), Transform(brace6, brace8), ApplyMethod(line4.shift, 0.8*UP*XTD), + ApplyMethod(line5.shift, 0.8*DOWN*XTD)) + + self.play(FadeOut(brace3), FadeOut(brace4), FadeOut(brace1), FadeOut(brace2)) + self.play(ApplyMethod(line2.shift, 0.8*RIGHT*XTD), ApplyMethod(line1.shift, 0.8*LEFT*XTD), ApplyMethod(br1text.scale, 10/3), ApplyMethod(br2text.scale, 10/3)) + for i in range(0,3): + self.play(ApplyMethod(line2.shift, 0.8*LEFT*XTD), ApplyMethod(line1.shift, 0.8*RIGHT*XTD), ApplyMethod(br1text.scale, 0.3), ApplyMethod(br2text.scale, 0.3), run_time = 0.5) + self.play(ApplyMethod(line2.shift, 0.8*RIGHT*XTD), ApplyMethod(line1.shift, 0.8*LEFT*XTD), ApplyMethod(br1text.scale, 10/3), ApplyMethod(br2text.scale, 10/3), run_time = 0.5) + + self.play(ApplyMethod(line2.shift, 0.8*LEFT*XTD), ApplyMethod(line1.shift, 0.8*RIGHT*XTD), ApplyMethod(br1text.scale, 0.3), ApplyMethod(br2text.scale, 0.3), run_time = 0.5) + + self.wait(5)
\ No newline at end of file |
