diff options
Diffstat (limited to 'FSF-2020/calculus/intro-to-calculus')
6 files changed, 312 insertions, 0 deletions
diff --git a/FSF-2020/calculus/intro-to-calculus/README.md b/FSF-2020/calculus/intro-to-calculus/README.md index e69de29..a417361 100644 --- a/FSF-2020/calculus/intro-to-calculus/README.md +++ b/FSF-2020/calculus/intro-to-calculus/README.md @@ -0,0 +1,8 @@ +Contributor: Aryan Singh
+Subtopics covered
+ - When do limits exist?
+ - How Fast am I going?-An intro to derivatives
+ - Infinte sums in a nutshell(Riemann integrals)
+ - Fundamental Theorem of calculus
+ - Volume and surface area of Gabriel's Horn
+ - Infinite sequences and series
diff --git a/FSF-2020/calculus/intro-to-calculus/introderivative/derivative1.py b/FSF-2020/calculus/intro-to-calculus/introderivative/derivative1.py new file mode 100644 index 0000000..79a6fc6 --- /dev/null +++ b/FSF-2020/calculus/intro-to-calculus/introderivative/derivative1.py @@ -0,0 +1,55 @@ +from manimlib.imports import * +class derivative1(GraphScene, Scene): + def setup(self): + GraphScene.setup(self) + CONFIG = { + "y_max" : 4, + "y_min" : -2, + "x_max" : 4, + "x_min" : -2, + "y_tick_frequency" : 1, + "x_tick_frequency" : 1, + "axes_color" : WHITE, + "num_graph_anchor_points": 3000, #this is the number of points that graph manim + "graph_origin" : ORIGIN+2*DOWN+4*LEFT, + "x_labeled_nums": list(range(-2,5)), + "y_labeled_nums": list(range(-2,5)), + "x_axis_label":"$x$", + "y_axis_label":r"$f(x)=y= 3-\frac { 3 }{ 2 } x$", + "x_axis_width": 5, + "y_axis_height": 5, + } + def construct(self): + #XTD = self.x_axis_width/(self.x_max - self.x_min) + #YTD = self.y_axis_height/(self.y_max - self.y_min) + + text1 = TextMobject("") + text2 = TexMobject("{y}_{2}-{y}_{1}") + text2 = TexMobject("{x}_{2}-{x}_{1}") + text3 = TexMobject(r"m\quad =\frac { { y }_{ 2 }-{ y }_{ 1 } }{ { x }_{ 2 }-{ x }_{ 1 } }").move_to(np.array([3,0,0])) + text4 = TexMobject(r"m\quad =\frac { 3 }{ -2 }").move_to(np.array([3,0,0])) + text5 = TexMobject(r"m\quad =\quad -1.5").move_to(np.array([3,0,0])) + self.setup_axes() + graph_1 = self.get_graph(lambda x : 3-1.5*x, color = GREEN_SCREEN, x_min = -1, x_max = 3) + graph_2 = self.get_graph(lambda x : 3.1-1.5*x, color = ORANGE, x_min = 0, x_max = 2) + dot1 = Dot() + dot2 = SmallDot(self.graph_origin+1.7*RIGHT, color = PINK) + dot3 = SmallDot(self.graph_origin+2.5*UP, color = RED_B) + vec1 = Vector(2.5*DOWN, color = PINK).shift(self.graph_origin+2.5*UP) + vec2 = Vector(1.7*RIGHT, color = RED_B).shift(self.graph_origin) + brace1 = Brace(vec1, LEFT) + brace2 = Brace(vec2, DOWN) + br1text = brace1.get_text(r"${y}_{2}-{y}_{1}$").next_to(brace1, LEFT) + br2text = brace2.get_text(r"${x}_{2}-{x}_{1}$").next_to(brace2, DOWN) + self.play(ShowCreation(graph_1), ShowCreation(dot2), ShowCreation(dot3)) + self.play(MoveAlongPath(dot1, graph_2), ShowCreation(vec1), ShowCreation(vec2), run_time = 3) + self.wait(1) + self.play(ShowCreation(brace1), ShowCreation(brace2)) + self.play(ShowCreation(br1text), ShowCreation(br2text)) + self.wait(2) + self.play(GrowFromCenter(text3)) + self.wait(2.5) + self.play(ReplacementTransform(text3, text4)) + self.wait(2) + self.play(ReplacementTransform(text4, text5)) + self.wait(2) diff --git a/FSF-2020/calculus/intro-to-calculus/limit/limit1.py b/FSF-2020/calculus/intro-to-calculus/limit/limit1.py new file mode 100644 index 0000000..fe5cb1e --- /dev/null +++ b/FSF-2020/calculus/intro-to-calculus/limit/limit1.py @@ -0,0 +1,105 @@ +from manimlib.imports import * +class limit1(GraphScene,MovingCameraScene): + def setup(self): + GraphScene.setup(self) + MovingCameraScene.setup(self) + CONFIG = { + "y_max" : 1, + "y_min" : 0, + "x_max" : 1, + "x_min" : -1, + "y_tick_frequency" : 0.2, + "x_tick_frequency" : 0.2, + "axes_color" : WHITE, + "num_graph_anchor_points": 3000, #this is the number of points that graph manim + "graph_origin" : ORIGIN+3*DOWN, + "x_labeled_nums": list(range(-1,2)), + "y_labeled_nums": list(range(0,2)), + "x_axis_label":"$x$", + "y_axis_label":"$f(x)$", + "x_axis_width": 10, + "y_axis_height": 5, + } + def construct(self): + XTD = self.x_axis_width/(self.x_max - self.x_min) + YTD = self.y_axis_height/(self.y_max - self.y_min) + + dot1 = SmallDot(np.array([0.025,-2.975,0])) + dot2 = SmallDot(np.array([-0.025,-2.975,0])) + sqr = Square(side_length = 15.0).move_to(np.array([0,-3,0])) + brline1 = DashedVMobject(Line(np.array([0.15,-3,0]), np.array([0.15,-2.85,0]))) + brline2 = DashedVMobject(Line(np.array([0.025,-3,0]), np.array([0.025,-2.975,0]))) + brline3 = DashedVMobject(Line(np.array([-0.15,-3,0]), np.array([-0.15,-2.85,0]))) + brline4 = DashedVMobject(Line(np.array([-0.025,-3,0]), np.array([-0.025,-2.975,0]))) + textdef = TextMobject("") + text003 = TextMobject("0.03").move_to(np.array([0.15,-3.05,0])).scale(0.1) + textazero1 = TexMobject(r"\approx 0").move_to(np.array([0.04,-3.05,0])).scale(0.1) + textazero2 = TexMobject(r"\approx 0").move_to(np.array([-0.04,-3.05,0])).scale(0.1) + textm003 = TextMobject("-0.03").move_to(np.array([-0.15,-3.05,0])).scale(0.1) + text2 = TextMobject("Let f(x) = |x|. We'll check neighbourhood of origin") + text3 = TextMobject("h has to be a very small number greater than 0").move_to(np.array([0,-3.3,0])).scale(0.2) + text4 = TextMobject("The point travels through range of neighbourhood").move_to(np.array([0,-3.3,0])).scale(0.19) + text5 = TextMobject("let h be equal to 0.03").move_to(np.array([0,-3.3,0])).scale(0.25) + text6 = TextMobject("Notice how the point never touches the origin").move_to(np.array([0,-3.3,0])).scale(0.2) + text7 = TextMobject("Green line shows the Right hand neighbourhood of origin").move_to(np.array([0,-3.3,0])).scale(0.17) + text8 = TextMobject("The point is approaching (0,0) for the values of x which are positive").move_to(np.array([0,-3.3,0])).scale(0.1) + text9 = TextMobject("Values of x are tending to 0 from positive side").move_to(np.array([0,-3.3,0])).scale(0.19) + text10 = TexMobject(r"\text {Notation for this is }",r"x\rightarrow { 0 }^{ + }").move_to(np.array([0,-3.3,0])).scale(0.25) + text11 = TextMobject("Similar case can be made for negative values of x").move_to(np.array([0,-3.3,0])).scale(0.19) + text12 = TextMobject("The point is approaching (0,0) for the values of x which are negative").move_to(np.array([0,-3.3,0])).scale(0.1) + text13 = TextMobject("Values of x are tending to 0 from negative side").move_to(np.array([0,-3.3,0])).scale(0.19) + text14 = TexMobject(r"\text {Notation for this is }",r"x\rightarrow { 0 }^{ - }").move_to(np.array([0,-3.3,0])).scale(0.25) + + + self.play(FadeIn(text2), run_time = 1.5) + self.wait(2.5) + self.setup_axes() + graph_1 = self.get_graph(lambda x : x, color = RED, x_min = 0, x_max = 1) + graph_2 = self.get_graph(lambda x : -x, color = RED, x_min = 0, x_max = -1) + graph_3 = self.get_graph(lambda x : x,color = RED, x_min = 0.005, x_max = 0.03) + graph_4 = self.get_graph(lambda x : x,color = GREEN_SCREEN, x_min = 0.03, x_max = 0.005) + graph_5 = self.get_graph(lambda x : -x,color = GREEN_SCREEN, x_min = -0.03, x_max = -0.005) + grp1 = VGroup(graph_1,graph_2) + grp2 = VGroup(brline2, textazero1) + grp3 = VGroup(textazero2, textm003, brline3, brline4) + self.play(ShowCreation(grp1)) + self.add(sqr) + self.play(ReplacementTransform(text2, text3)) + self.camera_frame.save_state() + self.play(self.camera_frame.set_width,2.25,self.camera_frame.move_to,sqr,run_time = 2) + self.wait(2.5) + self.play(ReplacementTransform(text3, text4), ShowCreation(dot1)) + self.wait(2.5) + self.play(ReplacementTransform(text4, text5), ShowCreation(brline1), ShowCreation(text003)) + self.wait(2.5) + for i in range(0,3): + self.play(MoveAlongPath(dot1,graph_3), run_time = 0.5) + self.play(MoveAlongPath(dot1,graph_4), run_time = 0.5) + self.play(ReplacementTransform(text5, text6), ShowCreation(grp2)) + self.wait(2) + self.play(FadeOut(dot1)) + self.add(graph_4) + self.play(ReplacementTransform(text6, text7)) + self.wait(2.5) + self.play(ReplacementTransform(text7,text8)) + for i in range(0,3): + self.play(MoveAlongPath(dot1,graph_4), run_time = 0.7) + self.play(ReplacementTransform(text8, text9)) + self.wait(2.5) + self.play(ReplacementTransform(text9, text10)) + self.wait(2.5) + self.play(ShowCreation(grp3), ReplacementTransform(text10, text11), FadeOut(dot1)) + self.add(graph_5) + for i in range(0,3): + self.play(MoveAlongPath(dot2, graph_5), run_time = 0.7) + self.play(ReplacementTransform(text11, text12)) + self.wait(2.5) + self.play(ReplacementTransform(text12, text13)) + self.wait(2.5) + self.play(ReplacementTransform(text13, text14)) + self.wait(2) + self.play(FadeOut(dot2), ReplacementTransform(text14, textdef)) + self.wait(2) + self.play(Restore(self.camera_frame)) + + self.wait(2.5) diff --git a/FSF-2020/calculus/intro-to-calculus/limit/limit3.py b/FSF-2020/calculus/intro-to-calculus/limit/limit3.py new file mode 100644 index 0000000..a4f07d7 --- /dev/null +++ b/FSF-2020/calculus/intro-to-calculus/limit/limit3.py @@ -0,0 +1,95 @@ +from manimlib.imports import * +class limit3(GraphScene, MovingCameraScene): + def setup(self): + GraphScene.setup(self) + MovingCameraScene.setup(self) + CONFIG = { + "y_max" : 10, + "y_min" : 0, + "x_max" : 100, + "x_min" : 0, + "y_tick_frequency" : 1, + "x_tick_frequency" : 10, + "axes_color" : WHITE, + "num_graph_anchor_points": 3000, #this is the number of points that graph manim + "graph_origin" : ORIGIN+3*DOWN+4*LEFT, + "x_labeled_nums": list(range(0,101))[::10], + "y_labeled_nums": list(range(0,11)), + "x_axis_label":"$x$", + "y_axis_label":"$f(x)$", + "x_axis_width": 10, + "y_axis_height": 5, + } + def construct(self): + XTD = self.x_axis_width/(self.x_max - self.x_min) + YTD = self.y_axis_height/(self.y_max - self.y_min) + sqr1 = Square(side_length = 15).move_to(np.array([1,0.5,0])) + sqr2 = Square(side_length = 15).move_to(np.array([-4,-3,0])) + + textdef = TextMobject("") + text20 = TextMobject("f(x) is not defined at x=50").move_to(np.array([1,0.3,0])).scale(0.2) + text21 = TexMobject(r"\text {f(x) is not defined in interval }",r" (-\infty ,\quad 1]").move_to(np.array([-4,-3.2,0])).scale(0.18) + text22 = TextMobject("1").move_to(np.array([-3.9,-3.05,0])).scale(0.2) + text1 = TexMobject(r"\text {Let }" ,r"f\left( x \right) =\begin{cases} \sqrt { x-1 } ,x\in \quad (1,\infty )-50 \end{cases}") + text2 = TextMobject("Graph of f(x) is ") + text3 = TextMobject("Right hand neighbour of 50 will approximately be 50.000001").move_to(np.array([1,0.3,0])).scale(0.15) + text4 = TextMobject("Left hand neighbour of 50 will approximately be 49.999999").move_to(np.array([1,0.3,0])).scale(0.15) + text5 = TexMobject(r"\text {Hence R.H.L }", r"=\lim _{ x\rightarrow { 50 }^{ + } }{ \sqrt { 50.000001 - 1 } } \approx 7.000000071").move_to(np.array([1,0.3,0])).scale(0.13) + text6 = TexMobject(r"\text{Hence L.H.L }", r" = \lim _{ x\rightarrow { 50 }^{ - } }{ \sqrt { 49.999999-1 } }\approx 6.999999929").move_to(np.array([1,0.3,0])).scale(0.13) + text7 = TextMobject("7.000000071").move_to(np.array([1.9,0.25,0])).scale(0.1) + text8 = TextMobject("6.999999929").move_to(np.array([0.1,0.25,0])).scale(0.1) + text9 = TexMobject(r"6.999999929\quad \approx \quad 7.000000071 \quad \approx 7").move_to(np.array([1,0.25,0])).scale(0.2) + text10 = TexMobject(r"\text{Because LHL }" ,r"\approx" ,r"\text{ RHL, Limit exists at x=50 and equals 7").move_to(np.array([1,0.25,0])).scale(0.13) + text11 = TextMobject("There is no Left hand neighbour of x=1").move_to(np.array([-4,-3.2,0])).scale(0.22) + text12 = TexMobject(r"\therefore\quad \lim _{ x\rightarrow 0 }{ f(x) } \quad =\quad \lim _{ x\rightarrow { 0 }^{ + } }{ f(x) } ").move_to(np.array([-4,-3.2,0])).scale(0.25) + text13 = TexMobject(r"\text {R.H.L =}",r" \lim _{ x\rightarrow { 0 }^{ + } }{ \sqrt { 1.000000000001-1 } } \quad \approx 0").move_to(np.array([-4,-3.2,0])).scale(0.13) + text14 = TexMobject(r"\therefore \quad \lim _{ x\rightarrow 0 }{ f(x)\quad =\quad 0 }").move_to(np.array([-4,-3.2,0])).scale(0.13) + self.camera_frame.save_state() + self.play(ShowCreation(text1)) + self.wait(3) + self.play(ReplacementTransform(text1, text2)) + self.wait() + self.play(ReplacementTransform(text2, textdef)) + self.setup_axes() + self.setup() + graph_1 = self.get_graph(lambda x : (x-1)**(1/2),color = PINK, x_min = 1, x_max = 49.9) + graph_2 = self.get_graph(lambda x : (x-1)**(1/2),color = PINK, x_min = 50.1, x_max = 100) + graph_3 = self.get_graph(lambda x : (x-1)**(1/2),color = PINK, x_min = 1.05, x_max = 1.001) + dot1 = SmallDot(color = PURPLE_A) + cir = Circle(radius = 0.01, color = GREEN_SCREEN).move_to(np.array([1,0.5,0])) + grp1 = VGroup(graph_1, graph_2, cir) + grp2 = VGroup(text7, text8) + self.play(ShowCreation(grp1)) + self.wait(2) + self.play(self.camera_frame.set_width,2.25,self.camera_frame.move_to,sqr1,run_time = 2) + self.wait(1) + self.play(ShowCreation(text20)) + self.wait(2) + self.play(ReplacementTransform(text20, text3)) + self.wait(3) + self.play(ReplacementTransform(text3, text5)) + self.wait(3) + self.play(ReplacementTransform(text5, text7), ShowCreation(text4)) + self.wait(4) + self.play(ReplacementTransform(text4, text6)) + self.wait(3) + self.play(ReplacementTransform(text6, text8)) + self.wait(1.5) + self.play(ReplacementTransform(grp2, text9)) + self.wait(1.5) + self.play(ReplacementTransform(text9, text10)) + self.wait(3) + self.play(self.camera_frame.set_width,2.25,self.camera_frame.move_to,sqr2,run_time = 2) + self.play(ShowCreation(text21), ShowCreation(text22)) + self.play(MoveAlongPath(dot1, graph_3), run_time = 3) + self.wait(3) + self.play(ReplacementTransform(text21, text11)) + self.wait(3) + self.play(ReplacementTransform(text11, text12)) + self.wait(3) + self.play(ReplacementTransform(text12, text13)) + self.wait(2) + self.play(ReplacementTransform(text13, text14)) + self.wait(3) + self.play(ReplacementTransform(text14, textdef)) + self.wait(2) diff --git a/FSF-2020/calculus/intro-to-calculus/riemannintegrals/README.md b/FSF-2020/calculus/intro-to-calculus/riemannintegrals/README.md new file mode 100644 index 0000000..a9ad0bb --- /dev/null +++ b/FSF-2020/calculus/intro-to-calculus/riemannintegrals/README.md @@ -0,0 +1,18 @@ +rierect1.gif +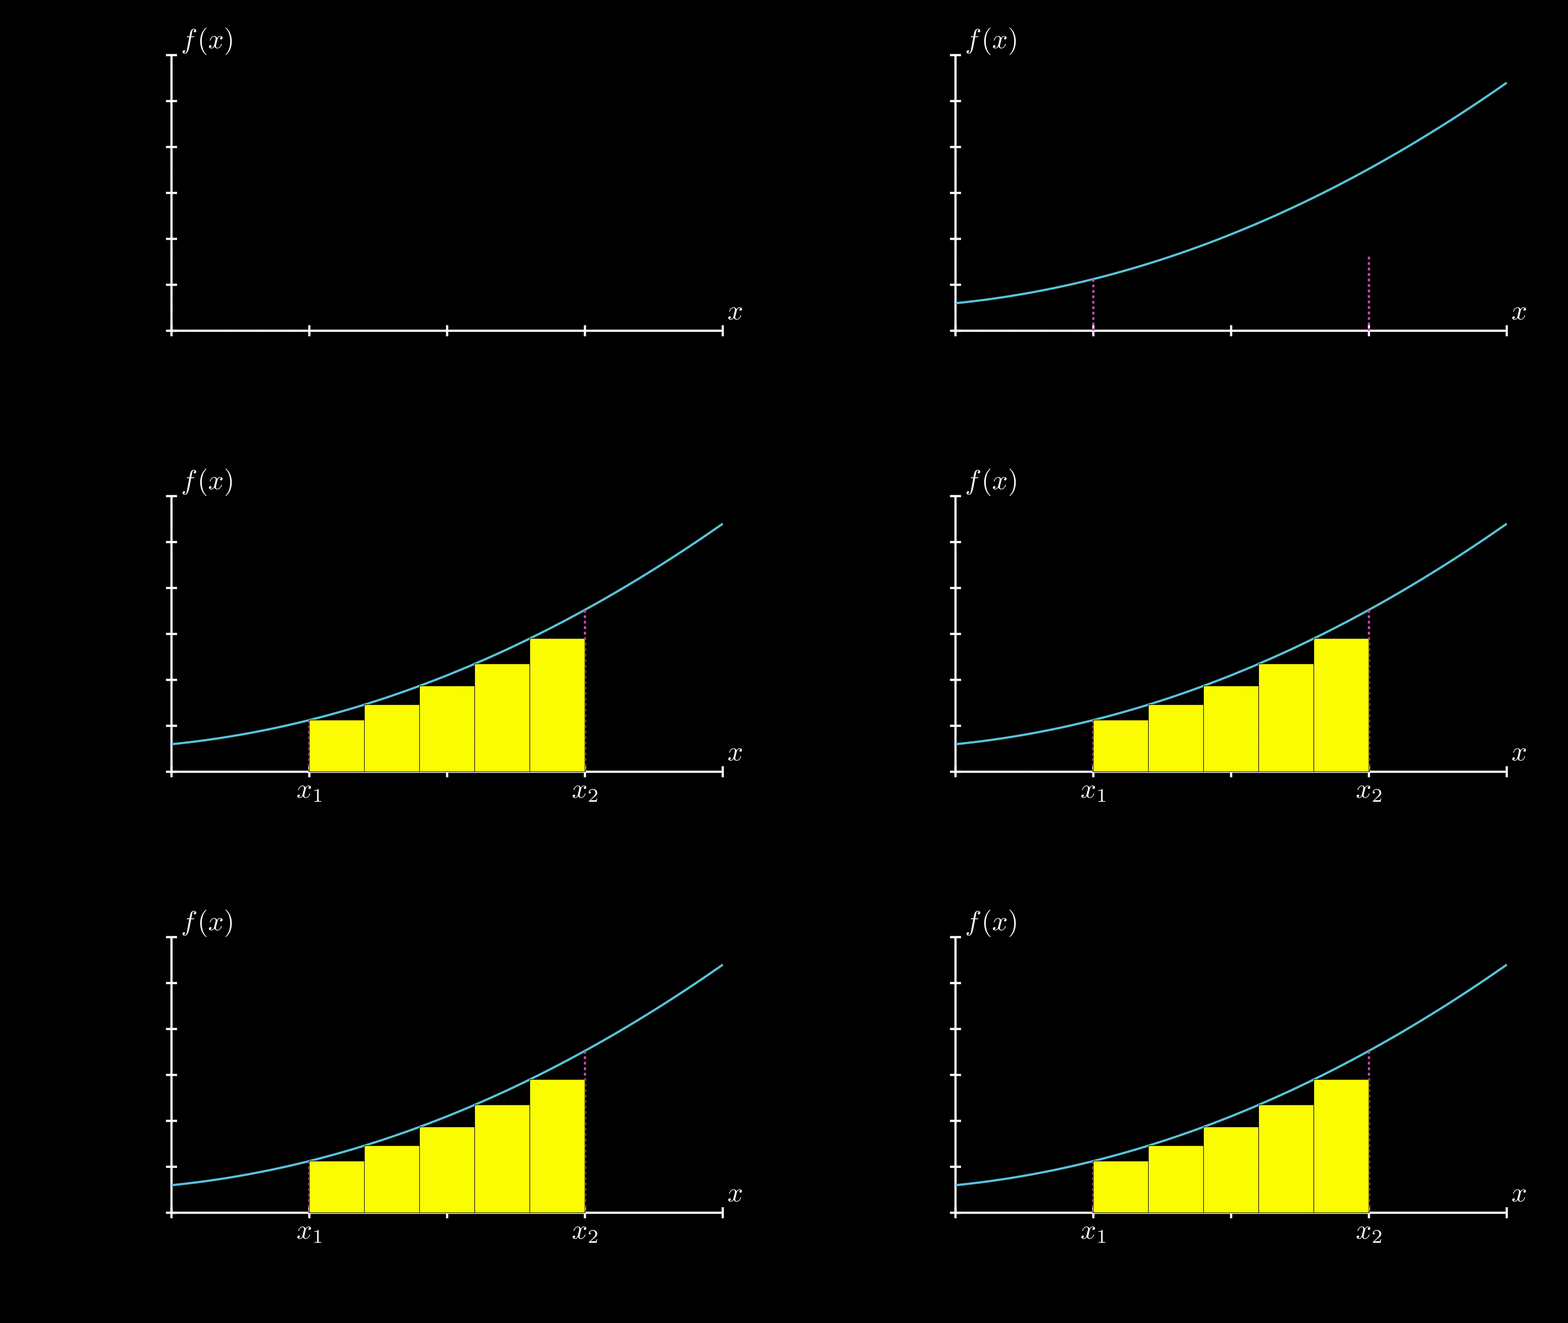 + + +rierect2.gif +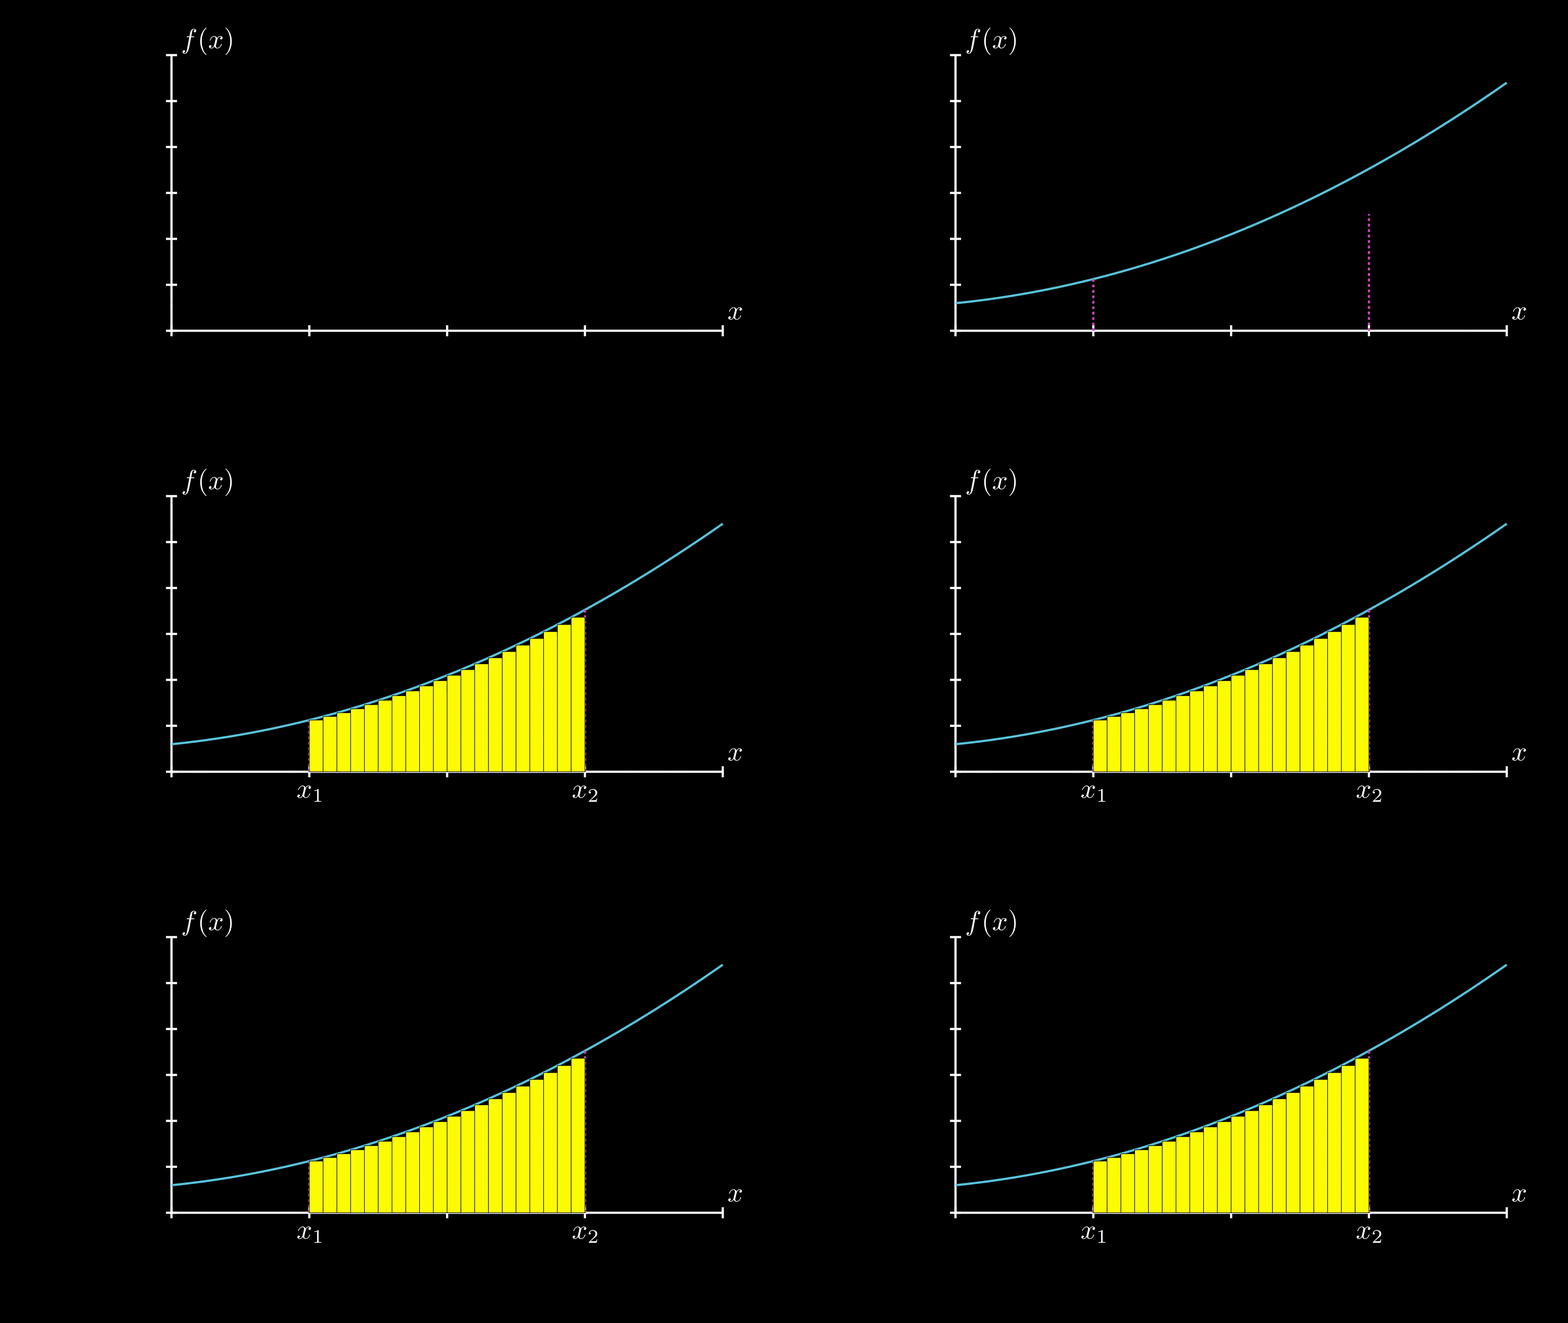 + + +rierect3.gif +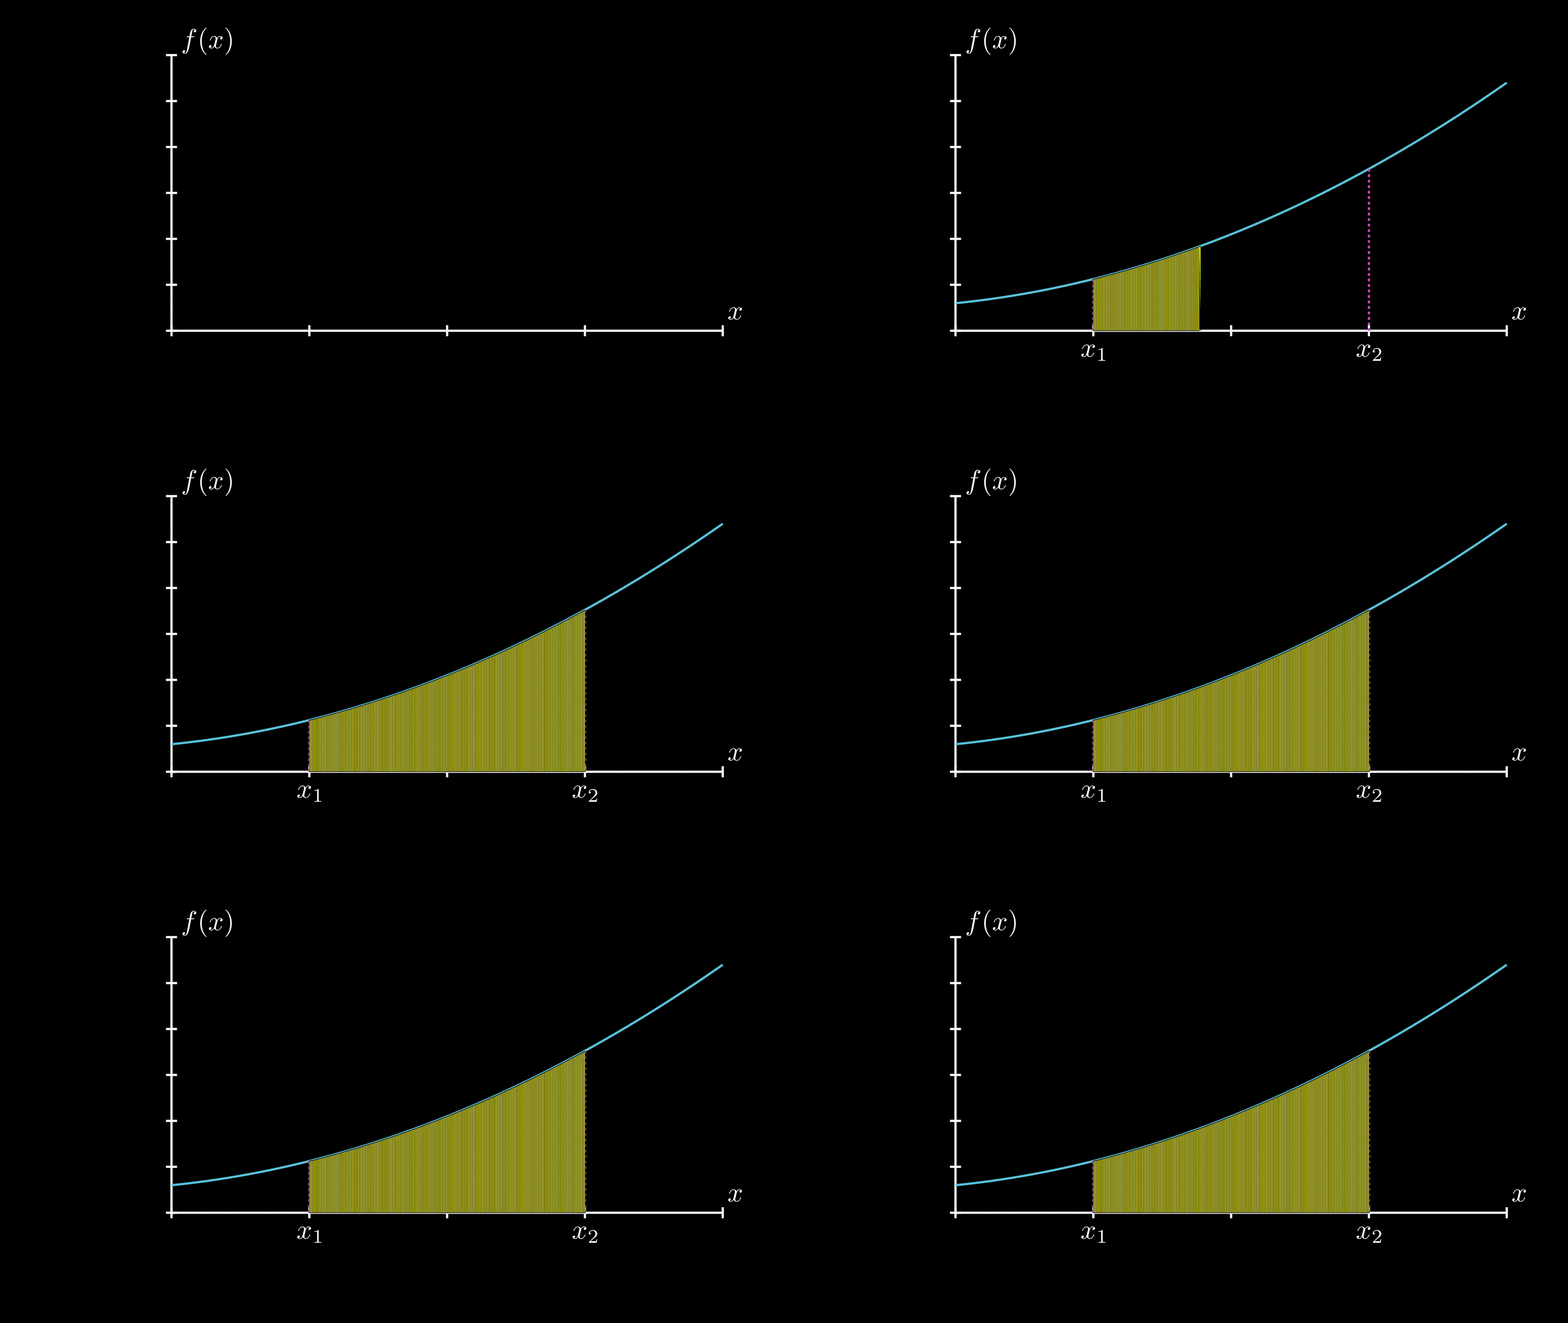 + + +RiemannRectanglesAnimation. +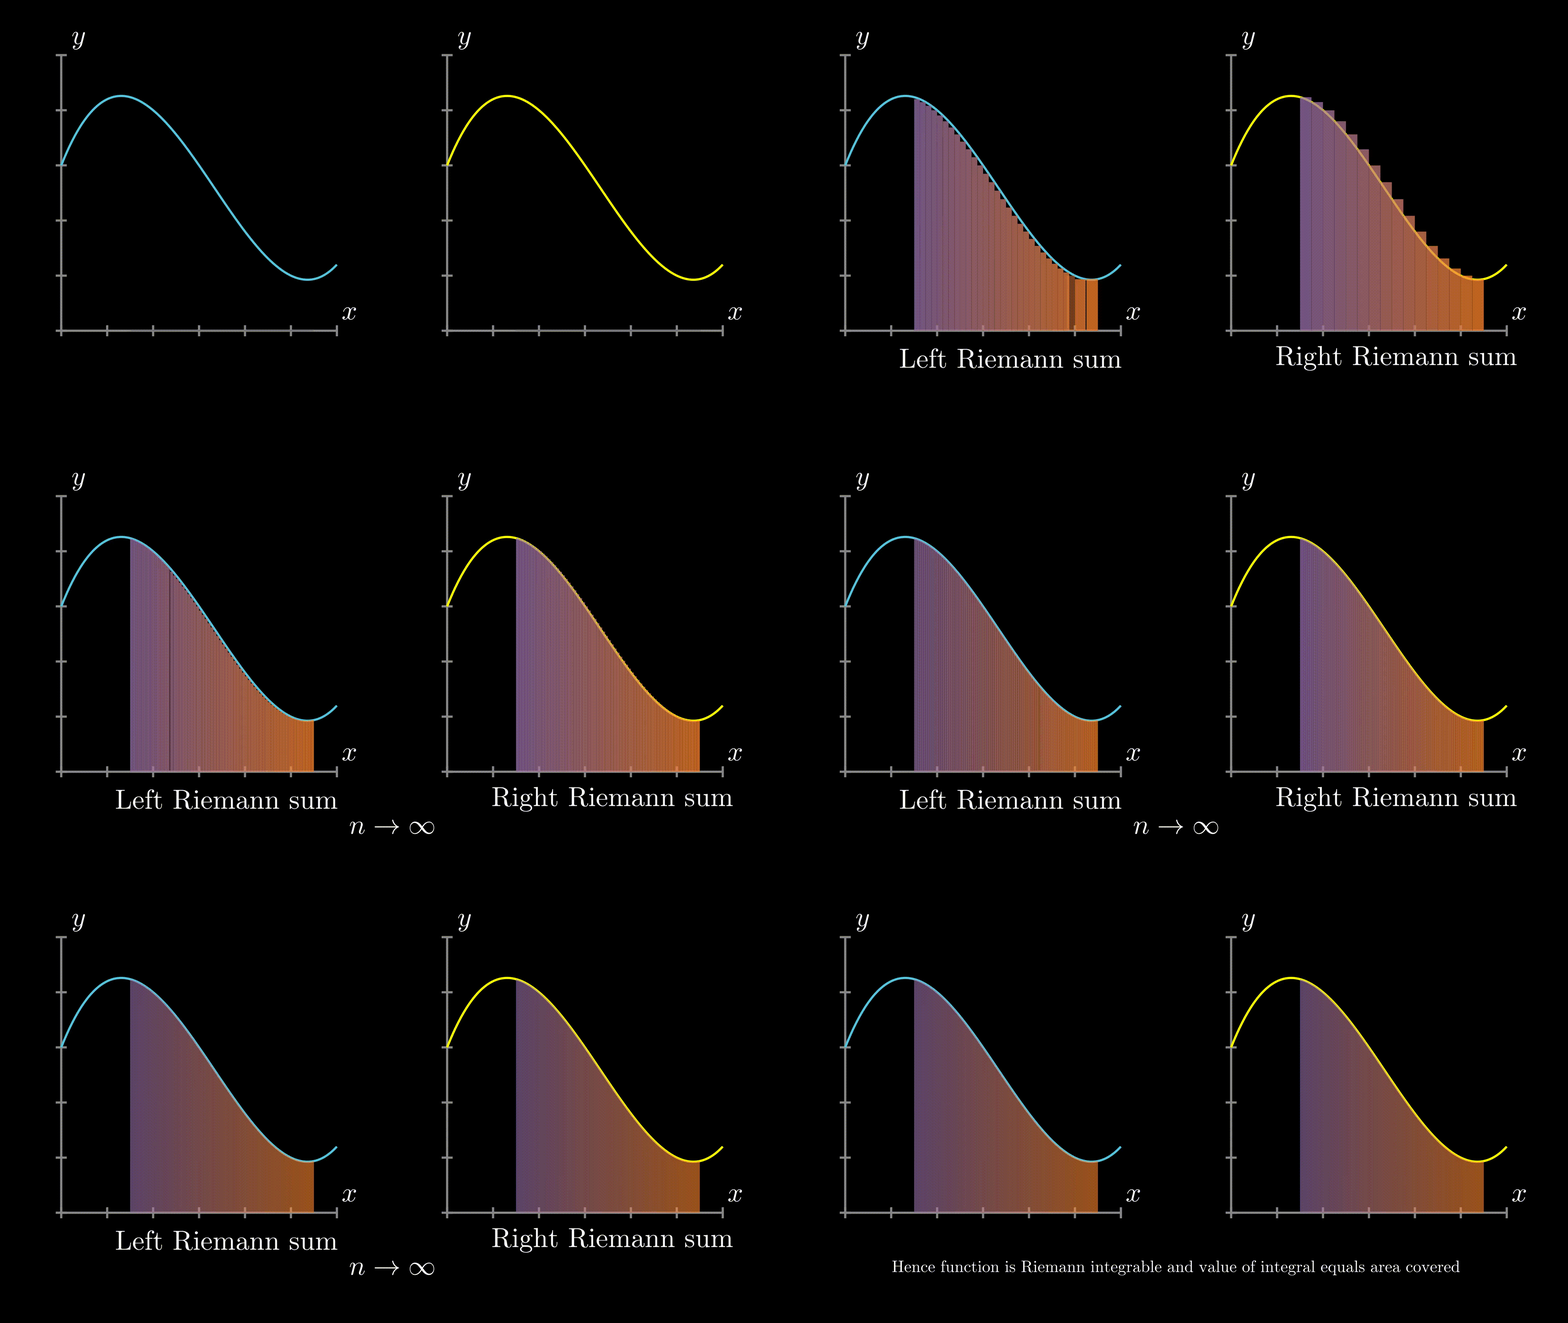 + + +mimi.gif +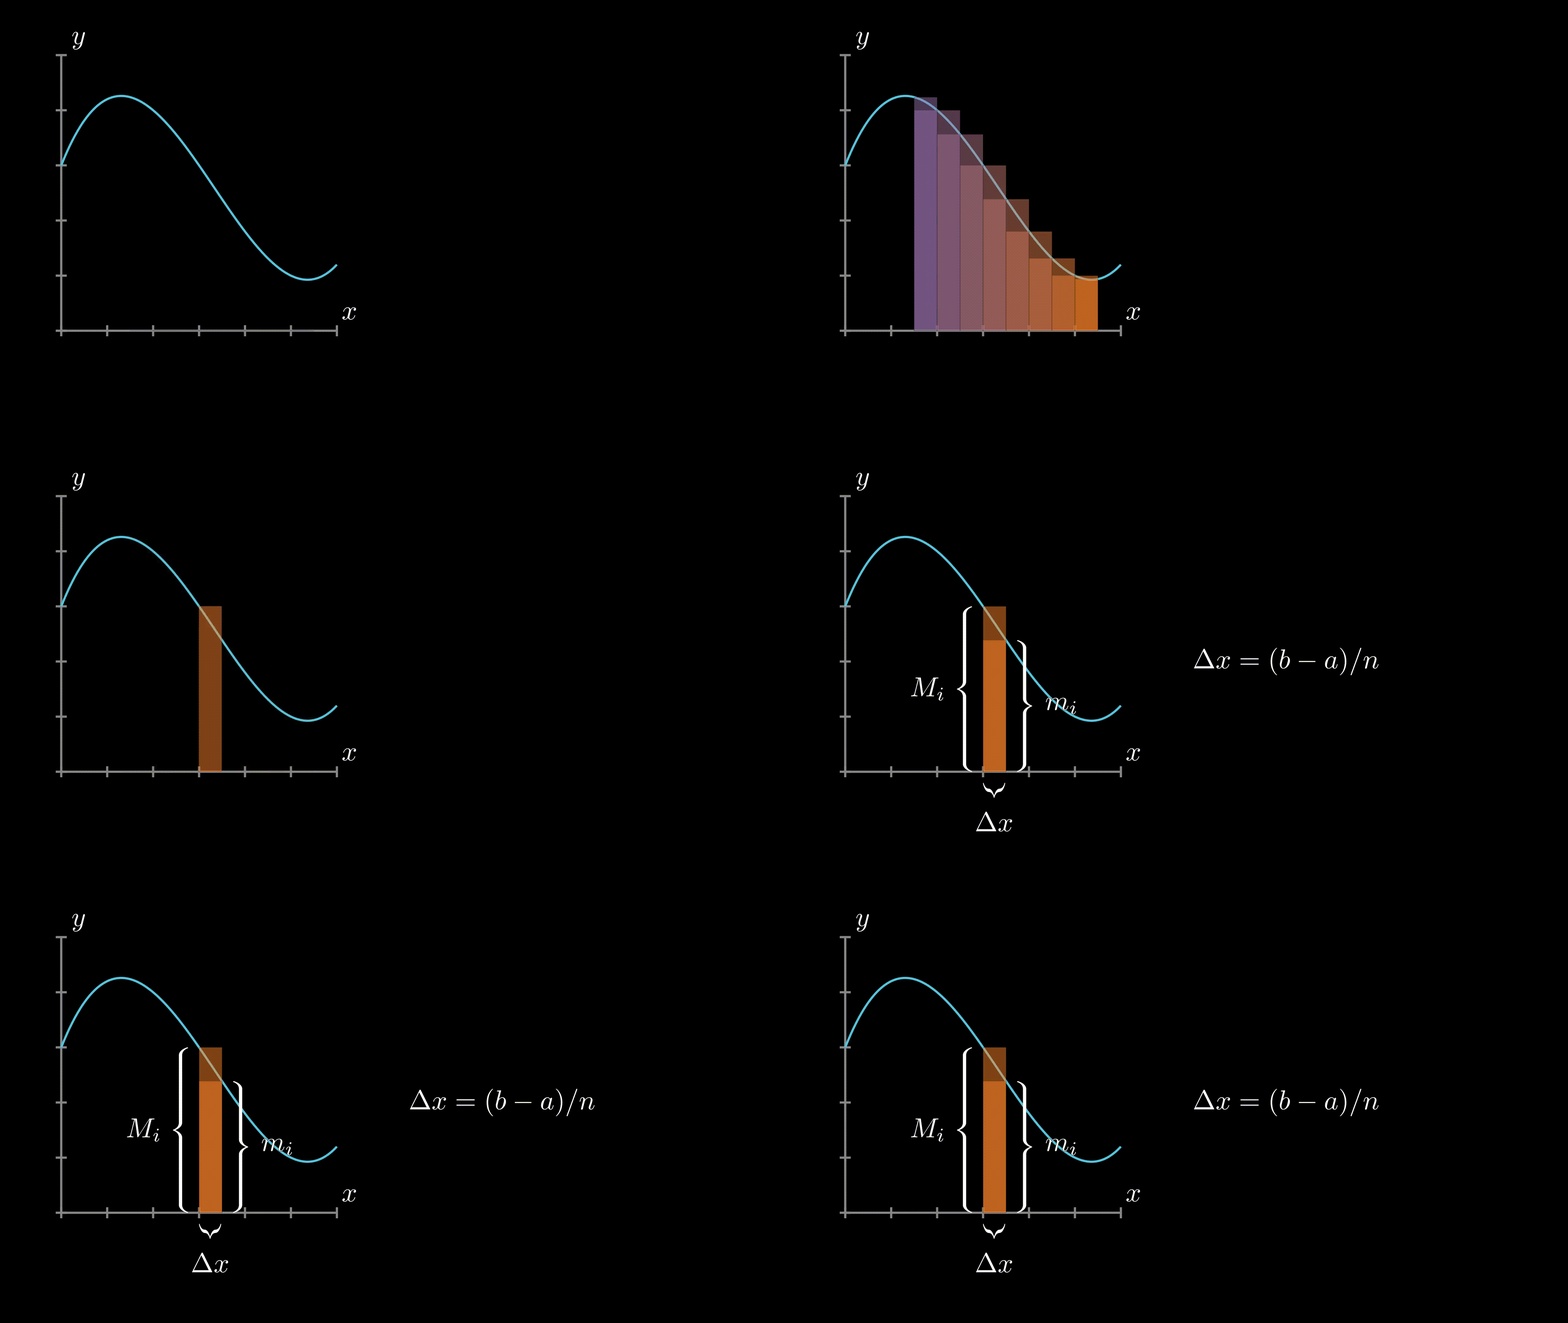 diff --git a/FSF-2020/calculus/intro-to-calculus/riemannintegrals/rierect1.py b/FSF-2020/calculus/intro-to-calculus/riemannintegrals/rierect1.py new file mode 100644 index 0000000..748d766 --- /dev/null +++ b/FSF-2020/calculus/intro-to-calculus/riemannintegrals/rierect1.py @@ -0,0 +1,31 @@ +from manimlib.imports import * +class rierect1(GraphScene): + CONFIG = { + "y_max" : 6, + "y_min" : 0, + "x_max" : 4, + "x_min" : 0, + "y_tick_frequency" : 1, + "x_tick_frequency" : 1, + "axes_color" : WHITE, + "num_graph_anchor_points": 3000, #this is the number of points that graph manim + "graph_origin" : ORIGIN+2*DOWN+4*LEFT, + "x_labeled_nums": None,#list(range(-1,2)), + "y_labeled_nums": None,#list(range(0,2)), + "x_axis_label":"$x$", + "y_axis_label":"$f(x)$", + "x_axis_width": 10, + "y_axis_height": 5, + } + def construct(self): + self.setup_axes() + graph1 = self.get_graph(lambda x : (0.1*(1.5*x+1)**2 +0.5), x_min = 0, x_max = 4) + minlim = self.get_vertical_line_to_graph(1,graph1,DashedLine, color = PINK) + maxlim = self.get_vertical_line_to_graph(3,graph1,DashedLine,color = PINK) + x1 = TexMobject(r"{x}_{1}").next_to(minlim, DOWN) + x2 = TexMobject(r"{x}_{2}").next_to(maxlim, DOWN) + rie1 = self.get_riemann_rectangles(graph1, x_min = 1, x_max = 3, dx = 0.4, input_sample_type = "left", fill_opacity = 1, start_color = YELLOW, end_color = YELLOW) + #rie2 = self.get_riemann_rectangles(graph1, x_min = 1, x_max = 3, dx = 0.01, input_sample_type = "right", fill_opacity = 0.5, start_color = PINK, end_color = LIGHT_PINK) + group = VGroup(graph1, minlim, maxlim, x1, x2, rie1) + self.play(ShowCreation(group)) + self.wait(1.5) |
